|
<< Click to Display Table of Contents >> NShape Basic Tutorial Basic Tutorial: Creating Diagrams |
  
|
|
<< Click to Display Table of Contents >> NShape Basic Tutorial Basic Tutorial: Creating Diagrams |
  
|
In this step you will learn how to create a diagram from your program and display it.
Now that your application has some basic functionality, let us come back to the original goal: Visualizing Web statistics. The goal is to read some statistics file that contains information about web pages and referrals and translate this information into a diagram.
For the sake of simplicity, a very simple text file format is defined for the input data. We do not choose XML, because we want to read large files fast and that is still simpler with a text file than with XML. Therefore the text file shall look like this:
www.dataweb.de/de/NShape.html;www.dataweb.de/de/index.html;724 |
Each line indicates the number of referrals from the first URL to the second one. The application will read the file line by line, create a shape for each URL it does not yet now and insert the shape into a dictionary, with the URL as the key. For the first step, we will arrange the shapes in a rectangular pattern. Later in this tutorial you will see how we can use the layouter to create a nicer presentation.
On a slightly higher level, here is how you are going to do it.
| 1. | Open the statistics file and create a StreamReader for it. |
| 2. | Create a diagram, just call diagram = new Diagram("My Diagram"). |
| 3. | Read the file line by line and do the following for each line: |
| 1. | Extract the first URL (the referrer) and look the URL up in the map. |
| 2. | If it is not yet there, create a shape, add it to the diagram and insert it into the map. |
| 3. | Do the same for the second URL. |
| 4. | Ignore the frequency for now. |
| 4. | Insert the diagram and its shapes into the repository and display it. |
|
The repository has two sets of methods for inserting and deleting objects: |
|
For performance reasons, the repository does no consistency checks by default. For developing applications that insert objects into the repository, we recommend adding and linking the project "NShape" to your application's solution and defining the conditional define REPOSITORY_CHECK |
Creating a shape is a bit different from creating a diagram, because shape libraries can be loaded dynamically. The project has a list of available shape types in its ShapeTypes property. You can select a shape type by its name and then call the shape type's CreateInstance method to create the actual shape.
After you have created the diagram you must add it to the repository, so that modifications can be tracked and the diagram can be saved. And finally, you display it.
|
This simple application can only display one diagram. Therefore, you should either delete all diagrams in the repository before adding a new one or you can modify the code that loads and displays the diagram. Otherwise you won't see the new diagram "D1". |
| 1. | Add namespaces Dataweb.NShape and Dataweb.NShape.Advanced. |
| 2. | Add menu item File > Load Statistics. |
| 3. | Create a handler for this menu item and insert the code below. |
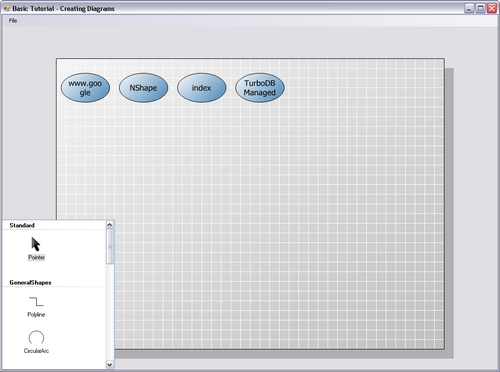
| 4. | Run the application and execute the menu command File > Load Statistics. The display shows an ellipse for each web page in the data file. |

This diagram has been created from statistical data through code.
Here is the code:
private void fileLoadStatisticsToolStripMenuItem_Click(object sender, EventArgs e) { |
Previous Step - Basic Tutorial - Next Step